

FP&A Mastery Signature Program ™
NEW · 12-Month Membership
- Experiential Learning for High-Achieving Finance & Accounting Professionals
Partial List of Current & Former Clients


Program Overview
FP&A mastery is the premier membership for high-achieving finance professionals
FP&A mastery is the ability to make good, defensible judgments about finance-related decisions, even in the face of high stakes and ambiguity. Leaders who exemplify FP&A mastery skills work at amazing corporations and rapidly-growing entrepreneurial companies.
A common misconception around these finance skills is that they’re something you either have or you don’t and they take many years to attain.
…but that’s not true.
In reality, you can significantly improve your financial planning & analysis (FP&A) influence + critical and strategic thinking ability by reframing your mindset and mastering a handful of core skills: business modeling, financial analysis, empathy and partnership, and effective communication.
The best FP&A professionals don’t think like analysts. They think like advisors. They’re higher-level thinkers. They understand how their insights connect to what others care about. And they’re masterful communicators. They don’t refer to themselves as masters, but they’re always in pursuit of mastery.
People who level up their FP&A technical and non-technical ability tend to get selected for better projects that are more interesting and challenging than those their peers get assigned to. Directors know these exceptional people can handle it and shine. When they succeed, they’re more likely to get promotions, higher pay, and even more exciting opportunities. Work is far more enjoyable and less frustrating because they’re now more capable, confident, and positive. This leads to a more inspiring career and a fulfilling life.
Influence through finance is a skill that can be rapidly developed by changing how you think through learning, application, practice, and ongoing support. This isn’t wishful thinking. This is reality for those who are committed to their own growth.
FP&A MASTERY SIGNATURE PROGRAM™ OVERVIEW:
This year-long membership gives you full access to weekly live, virtual courses and the complete library of module recordings, immersing you in the frameworks and techniques used by high-performing corporate finance practitioners. Through real-world examples, exercises, templates, models, discussions, and hands-on implementation, you’ll evaluate financial models, Excel techniques, analyses, reports, and dashboards to understand what makes them exceptional (or not). Each session challenges you to think more deeply about finance, modeling, influence, and communication—helping you elevate not just your technical skill set, but the way you think about and approach your work all year long.
9 Immersive Series:
- Cash Flow Forecasting & Modeling - Level 1
- Data Management for Finance w/ Power Query
- Cash Flow Mastery: Deep Dive Modeling - Level 2
- Advanced Financial and Business Modeling
- Claude, Copilot, and Dynamic Excel for Finance
- Budgeting and Rolling Forecasts
- Financial Analysis, Ops Management, and Business Partnering
- Delivering Effective Financial Presentations
- FP&A Technical Fluency and Strategic Thinking
* Each series is also available as a standalone course. If you are interested in an individual course, click the button below.
3 MEMBERSHIP LEVELS:
Choose the level of access that aligns with your goals.
Core Access delivers 12 months of CPE-eligible on-demand recordings for all 9 series, plus downloadable templates and future updates—ideal for independent, self-paced learners or those with conflicting calendars or time zones.
Professional Access includes everything in Core, plus guaranteed seats in live virtual classes, extended Q&A sessions, networking events, and additional CPE credits for live participation.
Inner Circle Access for those seeking direct support and implementation. This level provides our most comprehensive experience—adding 1:1 coaching, proprietary tools and models, priority referrals, a LinkedIn credential + digital badge, and a capstone case or company-specific project review with written feedback.
WHY ENROLL IN THE FP&A MASTERY SIGNATURE PROGRAM™ VS. INDIVIDUAL COURSES?
Individual courses will immerse you in the content of that single learning experience. The Signature Program gives you access to EVERYTHING across the full learning ecosystem:
- MASTERY MEMBERSHIP BENEFITS AND FEATURES*:
- 126 hours of live, hands-on instruction
- 12 months access to complete library of video recordings - available on day 1
- 50+ downloadable tools - templates, reports, models, and work files
- Up to 126 NASBA - approved CPE credits - video recordings and live attendance qualify
- Extended Q&A with your instructor(s)
- Networking events & bonus sessions
- 1:1 coaching hour with Carl
- Capstone case or company-specific project review + written feedback
*Benefits are dependent on membership level. See pricing tiers for details.
- THE FP&A MASTERY ECOSYSTEM AND FRAMEWORK:
- 50+ live learning experiences taught by domain experts all year round.
- Members can attend sessions live, watch recent or prior session recordings, and engage with asynchronous content in advance of live sessions.
- Courses are built specifically for FP&A, finance, and accounting professionals in ways that directly support efficiency and advancement at work.
- An active network of peers and referral sources to help troubleshoot challenges or make introductions.
WHO ATTENDS THESE PROGRAMS:
Since 2013, Seidman Financial has delivered hundreds of financial programs, workshops, strategic advisory sessions, and LinkedIn Learning courses to over 145,000 FP&A professionals from 25+ industries worldwide. Companies that have enrolled financial analysts, managers, and directors include:
ABM Industries, Accordion, Allscripts, Capitol Broadcasting, CHEP, Choice Hotels, CIBC, Cigna, Cox Enterprises, Crawford & Company, The U.S. Department of Housing and Urban Development, Discover, Energy Transfer, Erie Insurance, EVRAZ, Express Scripts, FS Investments, Genentech, Guy Carpenter, HCPI, Heartland Financial, HP Enterprise, Hormel, Hostess Brands, IGT, Marsh & McLennan, Merck, Michelin, NerdWallet, Outsystems, Rapid7, Rice University, Riveron, Santander, Sloan Valve, Sol Petroleum, Spotify, Telus, Triple-S, UBT, United Technologies, The University of Wisconsin-Madison, Verizon, Walmart, and Workday.
The curriculum in the FP&A Mastery Signature Program™ has been a cornerstone of FP&A training and financial leadership development at dozens of Fortune 500s, mid-market companies, and small entrepreneurial businesses.
- ELIGIBILITY REQUIREMENTS:
The FP&A Mastery Signature Program™ isn’t for everyone – it is for growth-focused finance professionals dedicated to reaching their next level of technical capability, communication, confidence, and success. They seek a higher level of enablement, empowerment, and assurance which can only be possible through longer-term commitment and community. The program is exclusively available to finance and accounting professions who meet the following criteria:
- Have been in a finance, accounting, and consulting role for at least five (5) years.
- Have overseen, either currently or in the past, junior-level finance staff.
- Are growth-focused, open-minded, and ambitious.
If you are eligible, tap into this community of like-minded high-achievers committed to your success. Immerse yourself in technical and non-technical development designed to change how you think and support you in reaching your next level of growth.
For companies with multiple attendees, group rate waivers are available.
FP&A Mastery Live Program Schedule
AUGUST
Financial Analysis & Ops Management
6 Sessions
Claude, Copilot, and Dynamic Excel for Finance
6 Sessions
SEPTEMBER
Financial Analysis & Ops Management
6 Sessions
Claude, Copilot, and Dynamic Excel for Finance
6 Sessions
OCTOBER
Cash Flow Mastery - Deep Dive Modeling - Level 2
8 Sessions
Cash Flow Forecasting and Modeling - Level 1
6 Sessions
NOVEMBER
Cash Flow Mastery - Deep Dive Modeling - Level 2
8 Sessions
Cash Flow Forecasting and Modeling - Level 1
6 Sessions
DECEMBER
🎄
Holiday Break
No sessions scheduled
JANUARY
Advanced Financial & Business Modeling
10 Sessions
Delivering Effective Financial Presentations
6 Sessions
FEBRUARY
Advanced Financial & Business Modeling
8 Sessions
Delivering Effective Financial Presentations
6-session program
MARCH
Advanced Financial & Business Modeling
10 Sessions
FP&A Technical Fluency & Strategic Thinking
9-session program
APRIL
FP&A Technical Fluency & Strategic Thinking
9 Sessions
MAY
Cash Flow Forecasting & Modeling - Level 1
6 Sessions
JUNE
CFF&M - Level 1
6 Sessions
Budgeting & Rolling Forecasts
6 Sessions
Data Management
6 Sessions
JULY
Budgeting & Rolling Forecasts
6 Sessions
Data Management for Finance with Power Query
6 Sessions
Who Is This Program For
Finance Directors and Managers responsible for team oversight, financially-driven decisions, and higher-level data-driven analysis.
Management consultants, FP&A advisors, and Fractional CFOs who offer business consulting services to small and midsized businesses.
Entrepreneurs planning to start a business and seeking foundational knowledge in financial management to ensure their venture is successful.
CFOs and financial analysts for SMBs who are tasked with data analysis, financial forecasting, and advising on financial matters.
Finance educators and professors who are looking to incorporate more experiential learning and business cases into their student journey.
What you’ll get out of this immersive financial learning & development experience, unlike any other you'll encounter:
-
Learn financial and business modeling, Excel, and financial analysis from a Microsoft MVP
Save time, minimize your rework, and eliminate your mistakes. Be spotlighted by your Directors, landing you better opportunities and the promotions you deserve. Learn modeling and analysis techniques from the 1 of the 35 US-based Microsoft MVPs in Excel. -
Tools, templates, models, and reports that you can implement right away
Get strategies, tools, templates, models, and systems that top FP&A teams use in their businesses. -
Apply what you learn to your work through business cases and practitioner-focused exercises
Exclusive capstone cases challenge you to apply what you learned. You'll receive personalized coaching from Carl and feedback others in the professional network. -
Develop a portfolio of your work that you can leverage in your current job or present to hiring managers if you’re seeking a new one
How do you land new opportunities at work if you don’t have the relevant experience? By getting relevant experience. Business cases will challenge you to push yourself into new domains. You’ll develop your own portfolio that you can take back to work or into new roles. -
Access to a network and community of top finance professionals you won't find anywhere else
Connection and collaboration opportunities with a global community of elite finance practitioners. -
Develop strategic financial planning capabilities.
Strategic financial planning goes beyond short-term budgets and forecasts. You'll learn how to align financial plans with business objectives, assess investment opportunities, and plan for long-term growth. -
Master cash flow forecasting and modeling
Cash flow is the lifeblood of any business. You'll discover how to analyze cash flow drivers, manage working capital, and implement strategies to optimize cash flow. -
Communicate deliverables for the benefit of your leadership
You will learn how to incorporate various aspects of finance -- including accounting, corporate finance, and investment analysis -- into your financial deliverables. This comprehensive approach will allow you to analyze and interpret financial data from multiple perspectives. -
An always-evolving professional development ecosystem
Supplementary programs, workshops, and coaching to put everyone around you — including your team — on the same page. -
Live support from the experts
1:1 accountability and guidance from Carl Seidman and peers that keep you on track and ensure you never have to go at it alone.
This Program Includes
Live Sessions
Learn directly from Carl Seidman CPA | Microsoft MVP in a real-time, interactive format.
Access to Session Recordings
Go back to course content and recordings whenever you need to.
Downloadable Tools
Download practical templates, reports, models, and work files you can use right away.
Peer Network
Stay accountable and share insights with like-minded professionals.
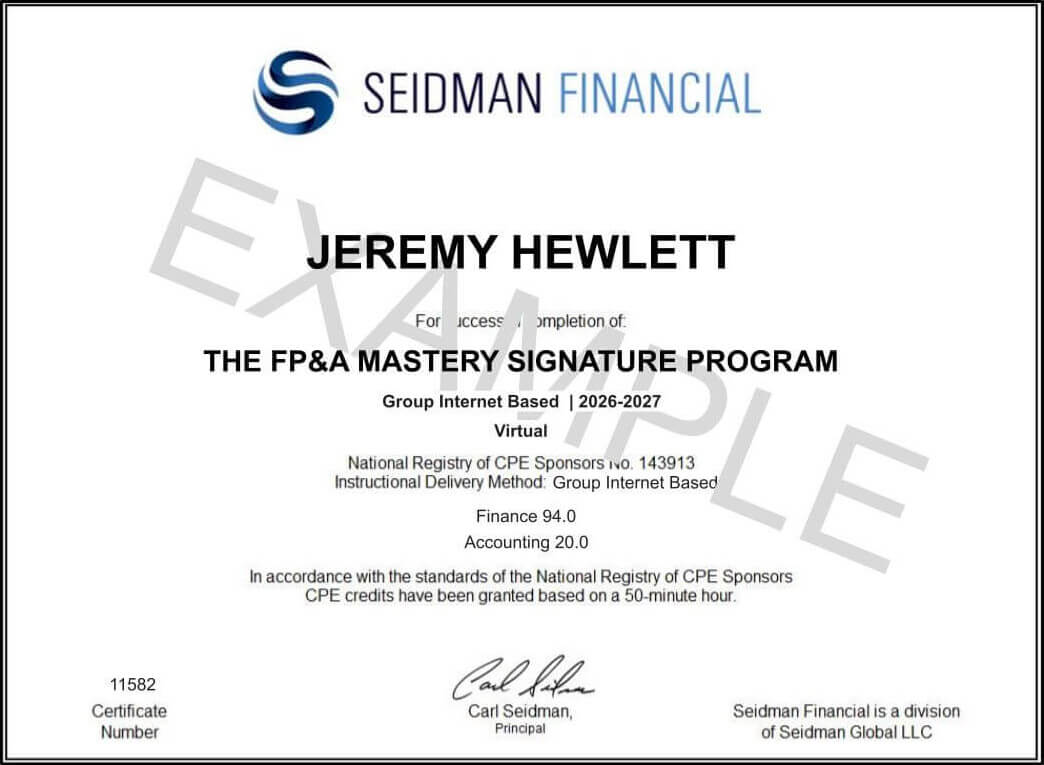
Certificate of Completion and CPE Credits
Share your new skills with your employer or on LinkedIn.
Course Syllabus
Click on the program title below to view the syllabus
"Carl is an excellent coach. He focuses on the practical aspect of the day-to-day challenges vs. only focusing on theory. I absolutely enjoyed this course and learnt a lot. Highly recommended."
-- Preet, Finance Director (Visa)
Meet Carl, Your Instructor and Guide
Carl Seidman CPA | Microsoft MVP
Principal, Seidman Financial
Carl is a go-to FP&A development facilitator for Fortune 500s, mid-market companies, and entrepreneurial businesses. He is a Microsoft MVP (1 of just 35 US-based Excel MVPs) and one of the preeminent trainers and facilitators in strategic finance and FP&A, with more than 13,000 participants attending his financial training programs, seminars, workshops, and masterminds. Notable clients include:
ABM Industries, Accordion, AlixPartners, Allscripts, Broadridge, CHEP, Choice Hotels, CIBC, Cigna, Cox Enterprises, Crawford & Company, Deloitte, Dexcom, Discover, Dominium, Express Scripts, EY, FS Investments, EVRAZ, Genentech, Healthpeak, Heartland Financial, Hewlett Packard Enterprise, Hostess, IGT, KPMG, Marsh & McLennan, Michelin, NerdWallet, Radisson, Rapid7, Sol Petroleum, Spotify, Triple-S, Telus, Santander, United Technologies (RTX), UBT, Verizon, Walmart, and Workday.
Carl is masterful at making the complex amazingly simple, engaging his audiences, building confidence, and facilitating a welcoming and transformative group experience. His content is rich and relatable, used in financial leadership development programs (FLDPs) at Fortune 500 companies, and is utilized or licensed by 7 of the top global financial training companies.
Carl serves as an Adjunct Professor in data analytics at the Jones School of Business at Rice University. He is a Certified Public Accountant (CPA) has earned other professional credentials including the CIRA, CFF, CFE, CGMA, AM (Accredited Member in Business Valuation), CSP (Certified Speaking Professional), Certified Anaplan Model Builder, and was a National Association of Certified Valuators and Analysts (NACVA) 40 Under Forty honoree. He holds a BA in finance and economics and an MS in managerial accounting.
He’s been where you want to be and does the work you want to do.
Contact: info@seidmanfinancial.com
"Carl is an excellent teacher and really cares about his students...he stayed after hours with me to talk me through how to apply to my specific model and was incredibly helpful...I'm almost done a week following the course with my new forecasting model."
-- Sarah, FP&A Sr. Mgr.
Course Schedule
Meeting Frequency
2-hour Sessions | 1x per Week + Occasional Bonus Sessions
Live meetings at a manageable pace! All sessions are recorded for future access, whether you miss a session or wish to revisit certain topics and discussions.
On-Demand Sessions
Missed a session? No problem!
Every live session is recorded so you can access it after it takes place.
Want to access to a live session and group discussion before it runs again? Get on-demand access to prior live cohort sessions any time you want.
Everything is at your fingertips.
Capstone Case Or Company-Specific Project Review*
At the conclusion of each core course
Capstone cases or project reviews may be completed at the end of each course after the conclusion of the final learning session.
Attendees may attend office hours and are given 1 week to complete the project. Upon submission, attendees will receive coaching and written feedback.
Office Hours*
At the conclusion of each core course
Guest Sessions*
Finance experts and software vendors
*Benefits dependent on membership level. See pricing tiers for details.
"This was my first course on business models, and Carl's course is very detailed and comprehensive. Carl is a great coach and makes financial modeling more accessible."
-- Sandrine, Senior Controller (Instabug, Inc.)
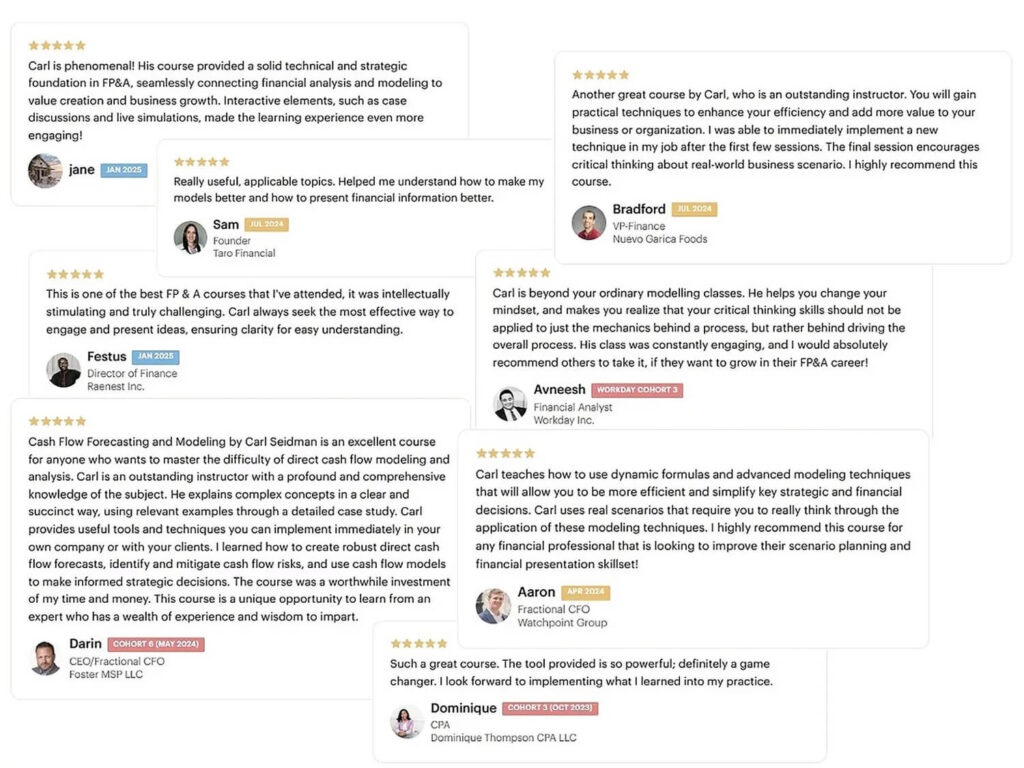
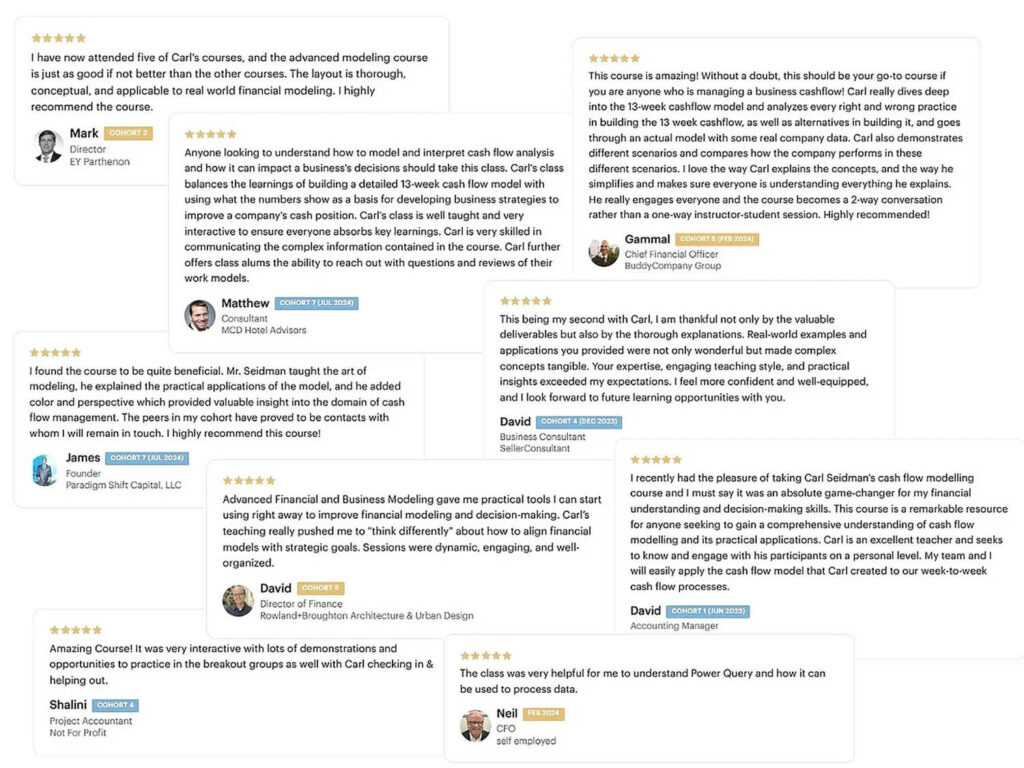
250,000+ FP&As have improved their technical and non-technical skills with Carl's courses. Here's what they have to say:
Join the FP&A Mastery Signature Program™
Here's what attendees of these courses have to say about the learning experience:
"Very interactive, and this helps reinforce key concepts. The course takes your thinking to a higher level as it creates the awareness of organizing the information in a logical and thoughtful way so that making future changes are easy."
-- Marian, Treasury Accountant (SLES Ltd)
Growth is so much better with live
cohorts and experiential learning
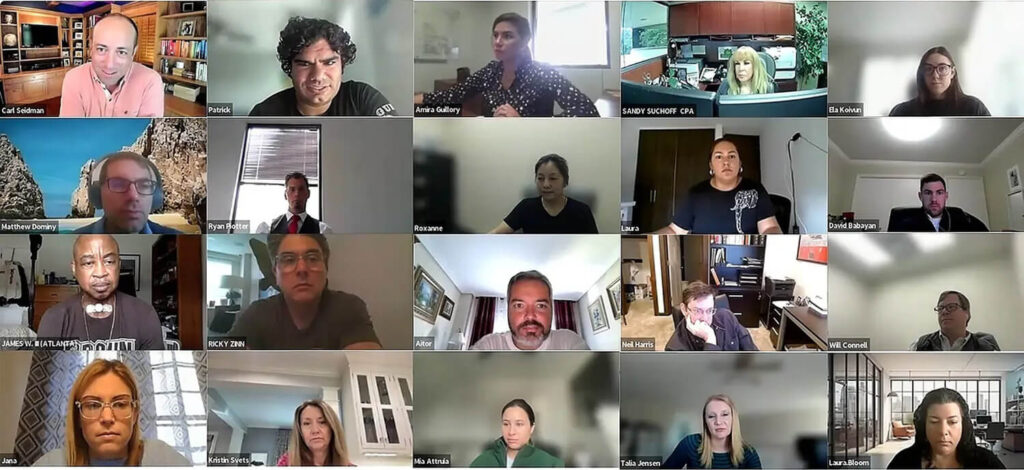
Active hands-on learning
This course builds on live workshops and hands-on projects
Interactive and project-based
You’ll be interacting with other learners through breakout rooms and project teams
Learn with a cohort of peers
Join a community of like-minded people who want to learn and grow alongside you
A one-of-a-kind experiential learning ecosystem, eligible for up to 126.0 CPE credits
Receive a certificate of completion to share with your network and coworkers
"Overall a great course for professionals looking for a refresher on modeling as well as more experienced FP&A Managers. The pace was great and Carl always made time for interaction and Q&A throughout the course."
-- Jeff, Director of FP&A and Operations Finance (Eos Energy)
Frequently Asked Questions
No problem. While you are encouraged to attend live sessions — as a great part of the experience is both the live-reveals and the participant interaction — all sessions are recorded and may be accessed on your own time.
Based on client feedback, we’ve added more breathing room to the schedule.
The experience is intentionally spaced out — each series is run 1 session per week for 2 hours.
Periodically, two courses will run concurrently, but they will take place on different days of the week.
Courses vary in length from 6 sessions to 10 sessions. See the program calendar above for more details.
There may be occasional pre-work and post-session work but it is minimal.
Because all sessions are recorded, you can revisit topics and discussions on your own schedule.
It is not customary for us to receive requests for refunds. However, if you are dissatisfied with your experience, please reach out to our customer service team so we can ensure you receive the value you expect.
We offer more than a dozen training programs and immersive development experiences across a wide range of finance and accounting topics.
Here are the standalone Seidman Financial program options.
This membership provides a huge cost savings vs purchasing courses a la carte.
In addition, the membership gives you the complete FP&A skill stack — not just one topic — with 8 live courses, full recording access, CPE credits, and ongoing development over 12 months. Instead of solving a single skills gap, it builds the technical, strategic, and communication capabilities needed to operate at a high-performing finance leader level.
Each course will meet live on Zoom for 2 hours, 1x per week.
Periodically, two courses will run concurrently, but they will take place on different days of the week.
Each session covers 1-2 learning topics. And classes do build on each other. Each session ties into prior and future sessions, so it is important to try to avoid missing classes or watched recordings.
The structure of the session begins with an intro, a tie-in to a real example, exercises, discussion, and reflections.
Prerequisites for the course include the following:
- You should have a basic-to-intermediate understanding of Microsoft Excel
- You should have a current version (2016 or later) of Microsoft Excel, ideally (though not necessary) on a PC.
- You should have at least an basic understanding of accounting and finance concepts.
No, but I will offer you my promises.
Everyone who attends this experience will have different backgrounds and aspirations which means they have different business models or jobs.
My promise is to share with you my techniques, tools, and processes that will accelerate your finance career and make you far more confident in what you do
Yes. Professional or Inner Circle Access includes many bonuses including:
– Networking events, bonus sessions
– Extended Q&A live and recorded sessions
– 1:1 office hour or coaching session
– Additional Tools – access to proprietary business models
– Priority client referrals
– LinkedIn Credential + Digital Badge
– Capstone case or company-specific project review + written feedback
Yes, it qualifies for 126.0 CPE credits.
Seidman Financial is registered with the National Association of State Boards of Accountancy (NASBA) as a sponsor of continuing professional education on the National Registry of CPE Sponsors. State boards of accountancy have final authority on the acceptance of individual courses for CPE credit.
Students can earn CPE credits two ways – by attending the live session and/or by watching the video recordings and completing a review assessment.
Yes! We offer installment payments through Affirm*. If you prefer a payment plan, Affirm allows you to select the payment structure (monthly, quarterly, etc.). You can review and apply for monthly terms at checkout.
*Subject to eligibility. Terms apply.
Most on-demand courses teach steps for plugging numbers into basic models. They don’t teach the nuances that you’re likely to encounter across a wide range of instances. And most course trainers don’t come from FP&A and CFO backgrounds.
According to alumni, this is the best FP&A course curriculum available.
While students can enroll in any course individually, the FP&A Mastery Signature Program™ is designed as the most comprehensive, high-value, learning experience in the FP&A space.
Students are encouraged to get the most complete experience versus enrolling in each course one at a time.
Sample Course Overview
Choose the level of access that aligns with your goals.
- Core Access
$2,500
- 12-month access to video recordings of all 9 programs
- Downloadable materials/templates
- Access to future updated recordings during the year
- CPE credits for every series - up to 126.0 credits
- Professional Access
$4,997
- 12-month access to video recordings of all 9 programs
- Downloadable materials/templates
- Access to future updated recordings during the year
- Up to 126.0 CPE credits for both live attendance and series’ recordings
- Live virtual attendance to all 8 programs
- Priority seat reservation (over standalone course purchasers)
- Networking events, bonus sessions
- Extended Q&A live and recorded sessions
- Inner Circle Access
Limited Capacity
$8,000
- 12-month access to video recordings of all 9 programs
- Downloadable materials/templates
- Access to future updated recordings during the year
- Up to 126.0 CPE credits for both live attendance and series’ recordings
- Live virtual attendance to all 8 programs
- Priority seat reservation (over standalone course purchasers)
- Networking events, bonus sessions
- Extended Q&A live and recorded sessions
- 1:1 office hour or coaching session
- Additional Tools - access to proprietary business models
- Priority client referrals
- LinkedIn Credential + Digital Badge
- Capstone Case or Company-Specific Project Review with Written Feedback
