How to see what’s actually happening inside a business when nobody’s asking the right questions – Part 2
Part 2: What the Data Actually Revealed (And What It Cost Them to Ignore It)
What do you do with a warehouse full of inventory nobody wants, and a leadership team emotionally tied to the products that built the company? The honest answer: you start with the data and you let it do the uncomfortable work for you first.
Business Is as Much About Emotions as It Is About Logic
When you have good, reliable data, it doesn’t have to be about taking sides with one loud voice in the company against another. I’ve faced this so many times in my work where co-owners or people in positions of authority fall victim to infighting. Instead, the winning approach is about presenting the facts — the reality on the ground of what’s actually happening versus what people ‘feel’.
You may think Hartwell’s story is unique — it’s not at all. It happens all the time, especially with small and midsized businesses:
- I remember working with an industrial workwear company in Europe that faced the same sort of challenges as Hartwell, where diversification and demand pulled the company in many different directions — one owner wanted to pursue the growth of the core product portfolio while another owner wanted to pursue expansion of their industrial gloves.
- With a Midwest-based health and wellness company I’d worked with, one owner wanted to pursue a combined strategy of pushing legacy products while at the same time investing in a high-demand consumer electronics. This was at odds with the other co-owner who wanted to pursue a lucrative licensing opportunity.
- With a global industrial products manufacturer, the sales team was pushing so hard to grow top-line revenue that it was splintering operations and customer services who couldn’t keep up.
Different industries. Same root issue: competing instincts and no shared truth. Companies can absolutely grow this way but they often grow themselves into a mess.
At Hartwell, one of the owners was so emotionally tied to a product category that he resisted even analyzing the numbers. I remember him saying, “Your numbers are wrong!”— even though the data came directly from his own system. That tension is exactly why we needed to step back and let the data do the uncomfortable work first.
Slicing the Sales
This meant building an analytical framework — taking raw sales data and reorganizing it in ways that made patterns visible. We sliced the revenue in at least four different ways. Each cut revealed something the previous one had obscured.
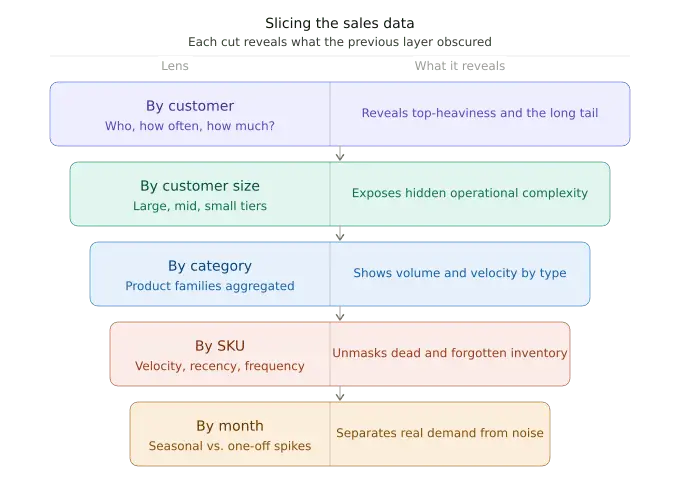
By Customer
Who was buying? How often? How much? We ranked every account from highest to lowest revenue over the trailing twelve months.
What immediately stood out was how top-heavy — and simultaneously how thin — the customer base was.
A small number of customers drove a disproportionate share of revenue, but not profit. As can often occur, the largest customers due to sheer volume, can command more favorable pricing. Their scale gave them pricing power and compressed margins.
Below them was a long tail of smaller accounts, many buying irregularly, often requesting one-off SKUs that were then sourced, stocked, and forgotten.
The revenue was all over the place.
By Customer Size
Once we segmented customers into tiers — for simplicity sake I’ll just call them large, mid, and small — the picture sharpened considerably.
Small accounts (low four figures in annual spend) were placing orders with disproportionate operational complexity: custom requests, frequent stockouts, higher returns, and constant service demands that consumed time no one was tracking. Yet everyone felt it.
The sales and customer service team was constantly busy but not productive.
Customers felt like customers, but they weren’t generating like customers. They were tying up the team.
By Category
At the category level — action figures, educational toys, arts and crafts — we could finally see which parts had real market demand and which were legacy catalog clutter.
A few categories had both volume and velocity. Most had neither.
What was even more telling: some strong categories contained clear underperformers that were being masked by overall performance. Without drilling down further, those issues remained hidden.
By SKU
This was the most uncomfortable cut.
We pulled velocity data: units sold, frequency of sale, and recency of last order. The results were stark, revealing that a meaningful portion of SKUs hadn’t sold in six months. Some hadn’t moved in over a year. They were occupying shelf space, tying up working capital, and appearing in a catalog that cost money to reprint and distribute.
They existed because at some point, someone asked for them and no one ever said no.
By Month
Layering in seasonality added another layer of clarity.
Some SKUs showed clear seasonal patterns. The revenue just wasn’t evenly distributed across the calendar. Others showed no seasonal pattern at all, just random one-off spikes that weren’t repeating.
That distinction matters when you’re deciding whether to invest, harvest, fix, or kill. It also helps to plan for the busiest months or when purchases slow.
The Threshold Question
One of the hardest parts of this kind of analysis is defining what “underperformance” actually means. There’s no universal rule. There’s no universal truth.
As I shared in Part 1, I’m not a toy expert. I’m a data and finance guy. So the thresholds had to reflect Hartwell’s business model, margins, and strategy. Not gut feelings.
While I can’t share exact figures, we set clear criteria across multiple dimensions:
- SKUs below a minimum sales threshold over twelve months were flagged
- SKUs with no sales in six months were placed on a termination list unless justified
- Customers below a revenue floor, combined with high service or return costs, were flagged for review
The goal wasn’t to be arbitrary. It was to force the conversation about what logically made sense. Instead of debating opinions, leadership now had to confront this reality:
“These are the products and customers failing YOUR OWN criteria.”
Thresholds can create accountability where instinct and familiarity prevent it. At Hartwell, that accountability was long overdue. But as useful as the thresholds were, they only told half the story. The other half was hiding in places many companies never think to look.
The Real Cost Problem: It Was Never Just About Sales and Gross Margin
This is where the analysis got both more important and more complicated. And it’s where I see companies go wrong over and over again. It’s why I highlighted earlier in my writing that this story isn’t just unique to Hartwell – there were three (3) other companies I’ve worked with that went through very similar experiences.
When most people think about product profitability, they look at gross margin: revenue minus cost of goods sold. Done. End of story.
That’s a mistake.
At Hartwell, many real costs weren’t being tied to products at all — they were buried in overhead.
What do I mean by this? Think about all of the operating expenses that show up in indirect overheads that never get factored into the cost of making, buying, selling, or shipping products. There are a bunch of them.
We identified five core cost categories that were routinely classified as indirect or overhead costs but were, in fact, directly attributable to specific products and customer segments:
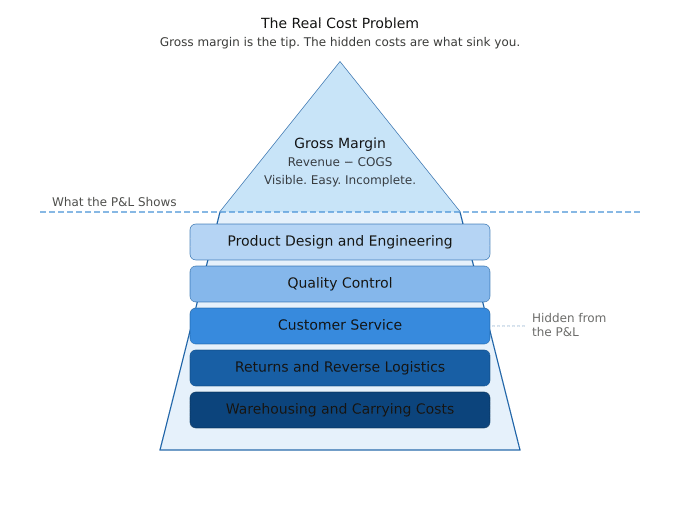
1. Product Design and Engineering
Some SKUs required supplier coordination, sampling, spec sheets, and QC. That work consumed staff time. Nobody was allocating it to the SKU. Why is that a problem? Because those efforts take time and relate to certain peoples’ salaries, software spend, and more. These efforts aren’t free and they get buried below the line (…the line being gross profit).
2. Quality Control
This was a silent killer. Products with higher defect or compliance rates required more inspection, more supplier communication, and more remediation. Those costs were spread across all products, masking the true underperformers. This meant the better products were quietly subsidizing the problem ones.
3. Customer Service
Certain customers and SKUs generated a wildly disproportionate number of service calls, complaints, and resolution cycles. One-off SKUs sourced for a single small customer account were notorious for this. The cost was invisible on the P&L above the line. It was a burden to SG&A.
4. Returns and Reverse Logistics
Returns aren’t free. They consume warehouse labor, create re-inspection costs, and often result in products being restocked that can’t be resold. We built a return rate by SKU and attached an estimated per-unit cost to process it. Some products had return rates that, once fully costed out, turned decent gross margin into a loser.
5. Warehousing and Carrying Costs
Warehouse shelves were abundantly stocked with slow-moving (or non-moving) inventory that tied up both physical space and working capital. This was especially critical given Hartwell’s stretched credit line.
A New P&L Reveals a New Reality
When we rebuilt the P&L with all these costs properly allocated, the picture changed dramatically.
Products that looked marginally profitable on a gross margin basis were clearly less, or even unprofitable, once fully burdened. Some customers who appeared to be solid mid-tier accounts were actually generating losses once we factored in service and fulfillment complexity.
It revealed why net margins were stuck below 3%.
This wasn’t just an overhead problem — it was structural. As the company chased revenue, its expanding product and customer base demanded more overhead, reinforcing the problem. And most importantly, it made one truth undeniable:
Not all products and customers were worth keeping. That was true at the gross margin level. It was even more obvious once fully costed.
These distinctions matter, because the solution is completely different.You don’t fix a contribution margin problem by cutting overhead. You fix it by exiting the products and customers creating the drag in the first place.
By the end of the analysis, we had a clear and honest picture of what was working and what wasn’t. But perhaps most importantly, it explained the why.
The data had done its job. But data doesn’t make decisions, people do. And in this case, two people still fundamentally disagreed.